The Insights Dashboard is designed to streamline and standardize data collection for easier reporting and to create data visualizations that help track key data points throughout the lifecycle of any number of opportunities (e.g., measure your return on investment, identify patterns in funding distributions, program participation, etc.). The Insights Dashboard can quickly display data over periods of time and be filtered in ways that are meaningful for your organization.
- Adding additional data points or requirements to their applications and progress reports, while preserving your data points. They get the data they need; you get what you need.
- Designing and managing the review/approval process. No need to change what works for them in their process since you still get the data you are after.
- Copying a launched competition that used Insights Template keeps the locked field, while also making it quick and easy for admins to launch the next cycle.

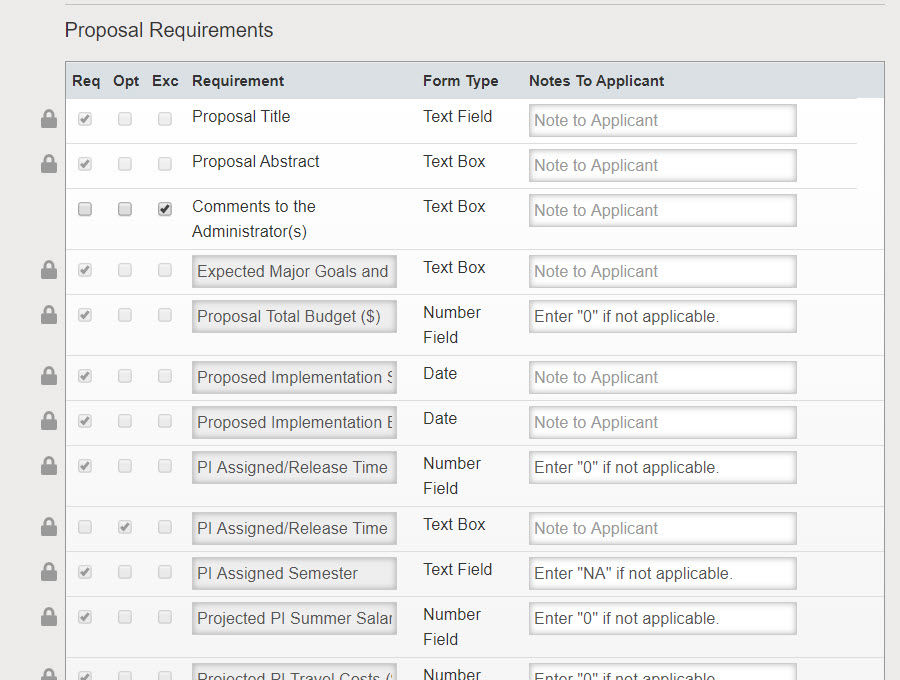
Example Insights Template with locked fields mapped to the Insights Dashboard
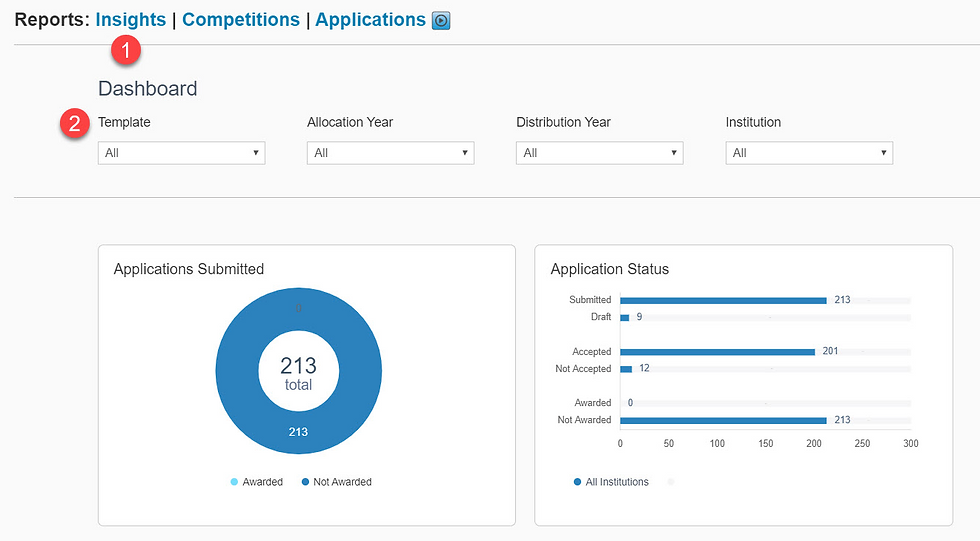
Insights Dashboard – The dashboard brings your data to life and serves as a tool to obtain aggregate reports. A suite of visualizations allows you to monitor activity on each of your Insights Templates. Some examples of data that can be tracked include:
- Status of all opportunities that use the template from draft through archive.
- Application status across all opportunities from draft through award.
- Progress report status for all awards.
- Funding allocations for all opportunities.
- Monitoring awards by funding source, effectively tracking your “burn down” of allocated funds.
In addition to these standard visualizations, the Insights Dashboard can bring your key data points into focus with custom visualizations.

Example Insights Dashboard with sample data
The Insights Dashboard is available as a paid add-on to any license level. Contact your Account Manager to learn more.


